The USDJPY moved slightly against the US dollar today after the Bank of Japan made its first rate decision.
January 21, 2021WTI has dipped slightly but overall look stable.
January 25, 2021EURUSD
The EURUSD continued to gain overnight despite impressive economic data from the US. The pair is trading at 1.2171, its highest level since Jan. 14. On the hourly chart, the pair managed to move above the key resistance at 1.2158. It also appears to be creating an inverted head and shoulders pattern as the price lies along the top line of the envelope indicator. Therefore, the pair should continue to rise as the bulls hit the next resistance at 1.2190.
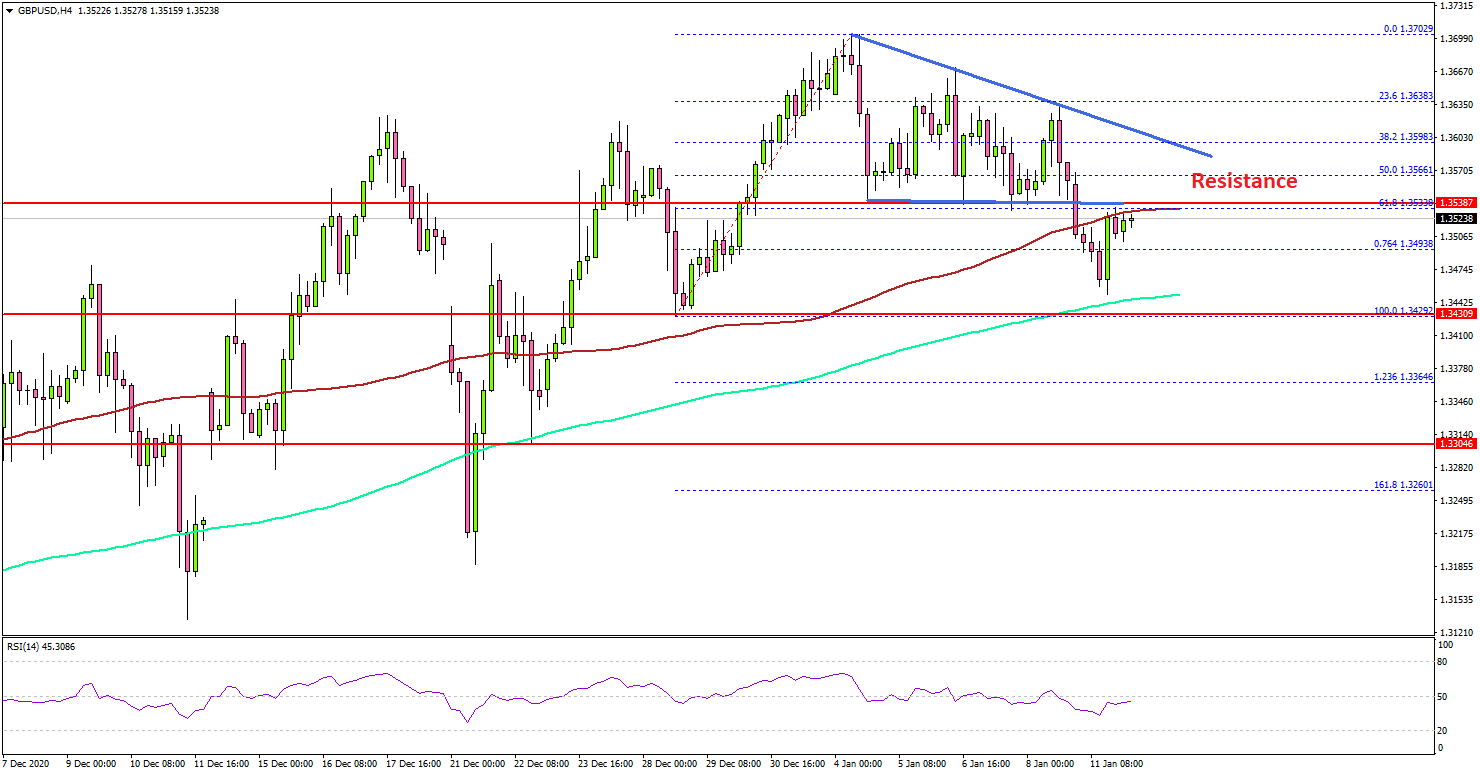
GBPUSD
GBP/USD is trading at 1.3718, which is slightly below yesterday’s high of 1.3745. On the four-hour chart, the price is above the 15-day and 25-day moving averages. This variable dynamic index is above average. The pair also formed a pattern of a climbing triangle shown in yellow. Therefore, it is likely to increase rapidly in the near future.
USD/JPY broke the 104.00 and 103.80 support levels to move into a short-term bearish zone. More importantly, the pair traded below the 50% Fib retracement level of the upward move from the 102.59 low (formed on 6th Jan 2021) to 104.39 high. There is also a major bearish trend line forming with resistance near 103.80 on the same chart. On the downside, the 103.00 level is a strong support. If there are more downsides, the pair may even decline below the 102.59 low. Conversely, the pair is likely to face a lot of hurdles near 103.70 and 103.80 levels if there is a recovery in the near term.
AUDUSD
AUDUSD is holding well below 0.78 and while that holds, a dip to 077 looks possible. A sustained break above 0.78 is need to take the currency further up towards 0.79-0.80 in the longer run.
USDCAD
After hitting 1.2588, USDCAD rebounded and the intraday bias became neutral. The 4 hour MACD is returning across the signal line. Some stability can be seen but the outlook remains with 1.2798 resistance held. The break at 1.2588 will start the downtrend from 1.4667. The next target is a 61.8% projection from 1.3367 to 1.2355 and 1.4667 to 1.2994.
WTI
WTI prices remain hovering around 54.45 in February 2020. Simple 20 day and 50 day moving averages appear to be moving up. If you fall through them, there is a risk that the technical inverse technical tendency will be carried over to the fish. Otherwise, clearing 54.45 exposes the January 20th, 2020 high.
XAUUSD
XAUUSD is stable near levels seen yesterday. We may expect a rise towards interim resistance at 1880 from where a dip towards 1860-1840 can be possible. Only a break above 1880 if seen and sustains will make the view bullish for a possible rise towards 1920 or higher in the medium term.
