GOLD drop from opening session might be maintain 1880$ area.
December 28, 2020EURO’s break 1.2272 resistance level suggests up trend resumption.
December 30, 2020EURUSD
The EUR/USD support zone at 1.2206 could not hold the negative impulse. The price dropped and headed for a test of the major target at 1.2161. A successful breach of the aforementioned zone would easily lead to future losses for the EUR against the USD and would pave the way to the lower support level at 1.2084. At the time of writing, the most probable scenario is for a retracement towards the level of 1.2206, which is now acting as a resistance. If the push is successful, we should see an attack of the upper target at 1.2268.
GBPUSD
GBP/USD even crossed the 1.3500 resistance zone, but it failed to gain more strength above 1.3600. There was a downside correction below the 1.3560 support level. There was also a break below a key bullish trend line at 1.3550 on the same chart. The pair spiked below the 38.2% Fib retracement level of the upward move from the 1.3304 swing low to 1.3618 high.
An initial support on the downside is near the 1.3460 level. It is close to a key multi-touch zone and also coincides with the 50% Fib retracement level of the upward move from the 1.3304 swing low to 1.3618 high. Any more losses could lead the pair towards the 1.3420 support and the 100 SMA. On the upside, an initial resistance is near the 1.3560 level. The main resistance is near the 1.3600-1.3620 zone. A close above the 1.3620 level is must for upside continuation.
USDJPY
The USD/JPY price consolidated around the 103.72 level. Only a confirmation of a positive breach here could lead the pair to an attempt for violation of the upper target at 104.03 where a success would strengthen positive sentiments of the market participants. If bears prevail, the decline could pave the way for a test of the support level at 103.49. A breach here could deepen the dip and lead the pair to a test of the important support zone at 103.27.
AUDUSD
A sixty-minute timeframe, Australian Dollar could not take out the highs of 17th December near 0.7640 and has pulled back to the 38.2% Fibonacci retracement from the lows of December 21st to today’s highs, near 0.7561. Watch for bounces to 0.7580/0.7600 to be sold. Additional support below at horizontal support and the 50% retracement level from the same timeframe is near 0.7523. The 61.8% Fibonacci retracement level comes in near 0.7523.
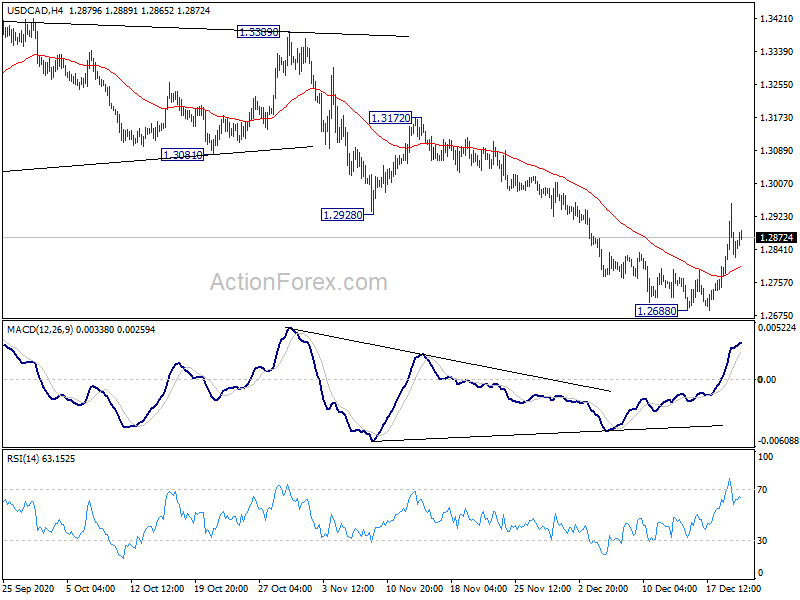
USDCAD
USD/CAD remains neutral for the moment. Another rise is mildly in favor with a short term bottom in place at 1.2688. On the upside, above 1.2957 will target 1.3172 resistance first. Break there will extend the rebound to 1.3389 key structural resistance next.
WTI entered a consolidative period in mid-December and the upward momentum appears to be faltering. An immediate resistance level can be found at US$ 49.40 – a recent high. A failed attempt to breach this level has resulted in a pullback to test its 20-Day SMA line. Breaking below the 20-Day SMA may open the door for further losses, with an eye on US$ 45.80 – the 23.6% Fibonacci retracement.
XAUUSD
Gold prices have advanced steadily since bulls reclaimed the positively-sloped 200-day SMA. Defending this key technical level seems to have sparked the resumption of buying pressures corresponding with a string of higher lows and higher highs. That said, eclipsing the critical barrier of resistance around $1,900 could recharge gold bulls. This potential breakout level might tee up a heartier push toward the 61.8% Fibonacci retracement level of the trading range developed since August.
