WTI crude oil prices continue to climb after the bullish implications
December 18, 2020GBP/USD is bounced from 1.3280 and still looking upside
December 23, 2020EURUSD
The EUUSD Key support is forming around the 1.2160 level and the local one for the day is found at 1.2200. The first resistance zone for the buyers is 1.2250-1.2270. Bullish sentiments are prevailing in the market and, after the recent test of 1.2160, we can expect an attempt for a breach of 1.2270, with a potential rally to the 1.2430 level. Should the enthusiasm wear off, the market could enter a new range between 1.2160 and 1.2270. A bearish scenario would be possible if trading falls below 1.2080.
GBPUSD
GBP/USD started a sharp decline below 1.3500 and it even broke the 1.3400 level. The decline gained pace and the pair even spiked below 1.3200. However, the pair found bids near a major support zone at 1.3180. There is also a crucial bullish trend line forming with support near 1.3180 on the same chart. The next major support is near the 1.3100 level and the 100-day simple moving average. If there are more downsides, the pair could start a sustained decline towards 1.2850 or even towards the 200-day simple moving average .On the upside, the pair is facing hurdles near the 1.3450 level. The next major resistance is near the 1.3500 level, above which it could revisit this month’s high in the near term.
USDJPY
USDJPY prices returned to the 103.27 support. Yesterday, the prime minister of Japan instructed the Ministry of finance not to let the USD/JPY fall below 100.00. That would surely attract speculators who would be willing to test the government’s resolve. It’s likely that every rally will be shorted as bears would target the psychological threshold of 100.00. First support zones at the moment are 103.27 and 103.01. The key resistance zones are found at 103.72 and 104.03. As long as prices stay below 104.03, bears would be the dominant power on this market.
AUDUSD
AUD/USD began a short-term downtrend on Monday after the pair dropped below Friday’s low. It appears that the pair used the 20-day simple moving average as support. If the intermediate-term uptrend can continue then the next major targets are 0.7675 and 0.7810. If the pair retreats further, then speculators should look to the 20-day SMA for further support. If price fails to hold above the 20-day SMA, then the next support level would be 0.7415.
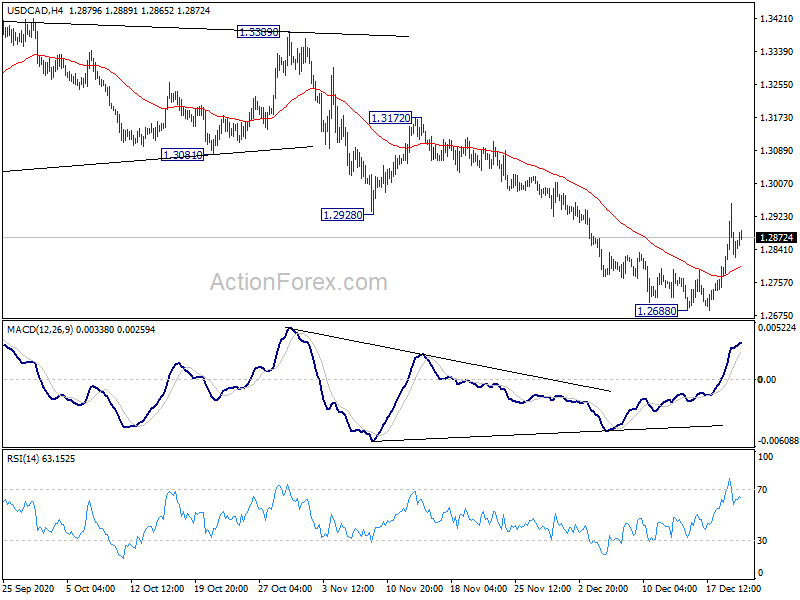
USDCAD
USD/CAD remains mildly on the upside at this point. A short term bottom was formed at 1.2668 on bullish convergence condition in 4 hour MACD. Further rise would be seen to 55 day EMA and break will target 1.3172 resistance. On the downside, break of 1.2688 low is now needed to confirm down trend resumption. Otherwise, risk will be mildly on the upside for more correction.
Technically, upward momentum appears to be faltering for WTI, with an MACD divergence observed on the daily chart. MACD divergence suggests fading momentum and flags risk for a pullback. An immediate resistance level can be found at US$ 49.40 – a recent high. A failed attempt to breach this level has resulted in a pullback to test its 20-Day SMA line. Breaking below the 20-Day SMA may open the door for further losses, with an eye on US$ 45.80 – the 23.6% Fibonacci retracement.
XAUUSD
Gold has dipped from higher levels seen yesterday morning. Gold fell off from 1908 itself before testing our mentioned resistance near 1920 but while that holds, view is bearish for a decline towards 1860 before another attempt to rise is seen.
