EUR/USD even surpassed the 1.2100 resistance zone before facing hurdle near 1.2180
December 7, 2020Gold price gained bullish momentum above the $1,800 resistance to move into a positive zone.
December 9, 2020EURUSD
EUR/USD is holding well below 1.22 and could trade within 1.22-1.21 region for some time before again heading higher. A possible test of 1.20 cannot be negated if Euro manages to break below 1.21.
GBPUSD
GBP/USD even broke the key 1.3400 resistance area and climbed above 1.3500 before facing hurdles. Looking at the 4-hours chart, the pair traded as high as 1.3538 and it settled well above the 200 simple moving average (4-hours). Recently, there was a downside correction below the 1.3500 and 1.3440 support levels. There was even a break below a major bullish trend line with support at 1.3340 on the same chart. The pair spiked below 1.3300 and the 100 simple moving average (4-hours). The pair traded as low as 1.3225 and it remains at a risk of more losses.
The next major support is near the 1.3180 level, below which the pair could test 1.3120. Conversely, the pair could start a fresh increase above the 1.3380 and 1.3400 resistance levels. The next major resistance at 1.3440 and 1.3445.
USDJPY
USD/JPY pair is remains neutral first. Larger decline from 111.71 is still in progress. Break of 103.65 should turn bias back to the downside for 103.17 low and below. This bearish case will remain favored as long as 105.67 resistance holds.
AUDUSD
AUD is trading slightly lower but is likely to be ranged for the near term. While above 0.70, we keep alive chances of seeing 0.75 or even 0.76 on the upside. Immediate downside could be limited to 0.74-0.73.
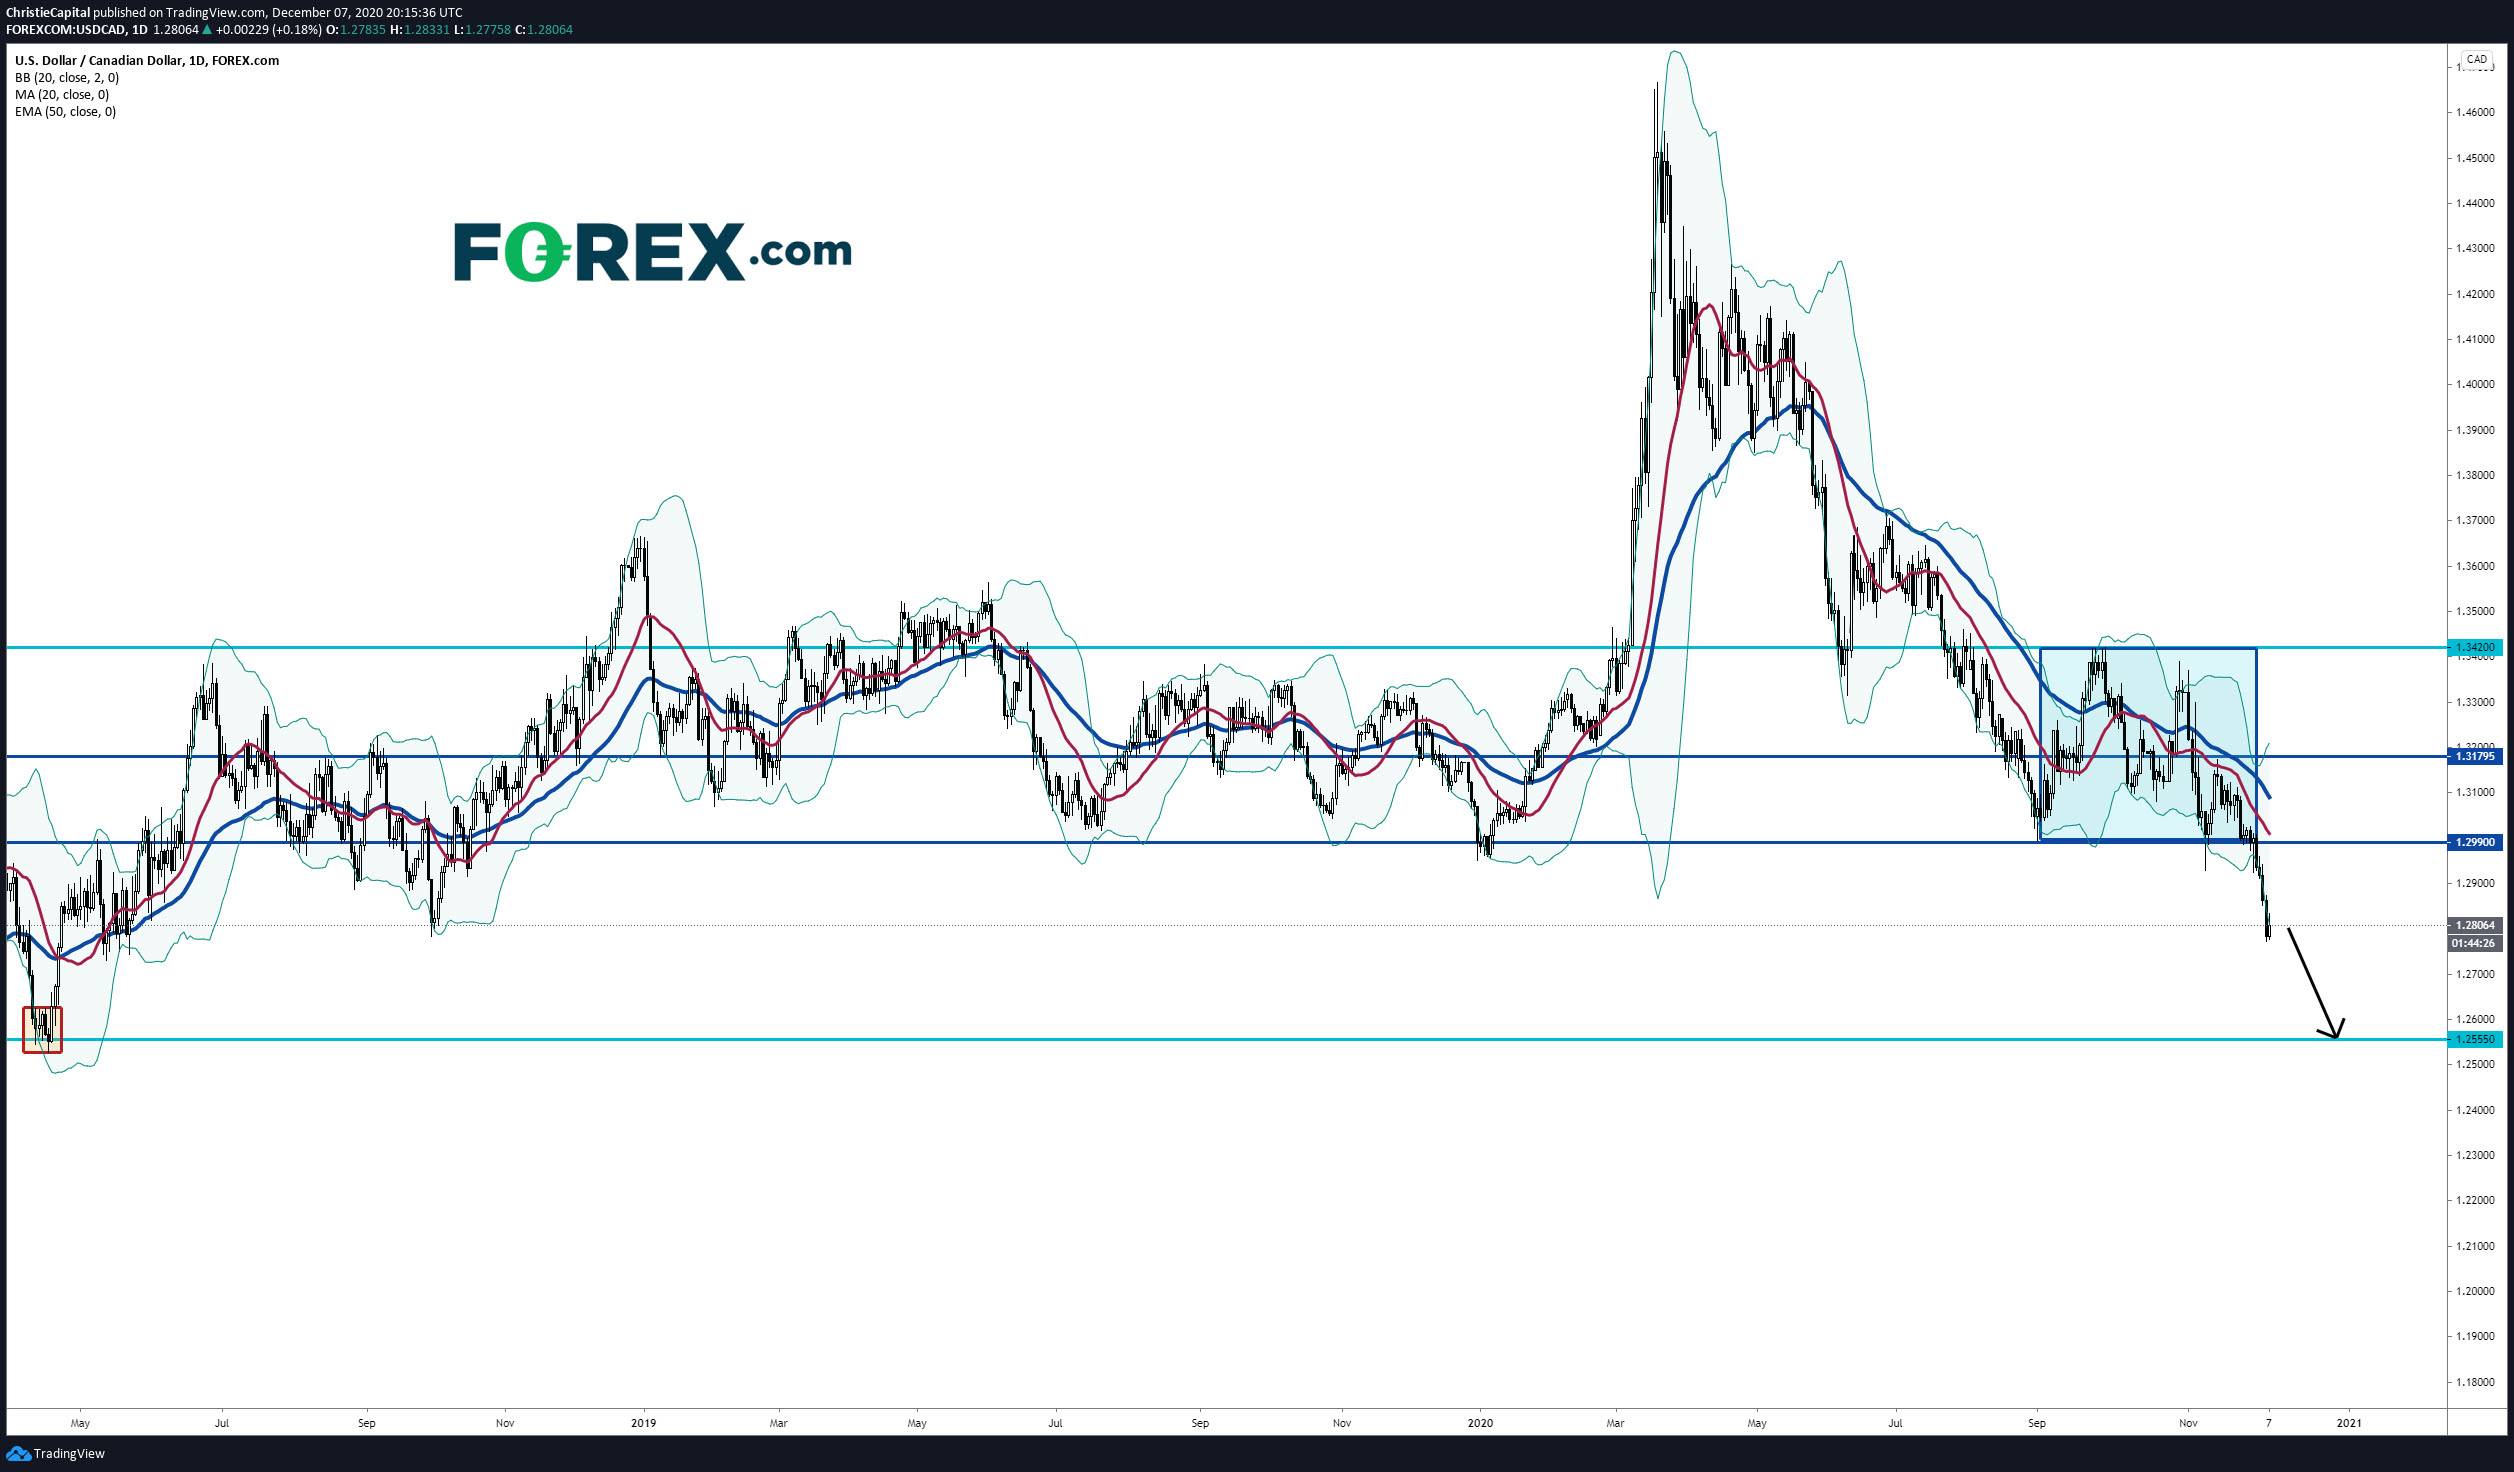
USDCAD
USD/CAD continues to show downside momentum on a daily chart after breaking below a consolidation zone that was in place since September. Previous support at the 1.2805 has been broken to the downside. The trend remains quite bearish. Look for a continuation lower towards 1.2555 as long as key resistance remains at 1.299.
Technically, WTI has likely formed a bearish pattern and since entered a consolidative period. Prices failed to break a key resistance at US$ 46.30 on a second attempt. More importantly, the MACD indicator has likely points out the potential trend reversal. A deeper pullback from here may lead to a test of $43.40 – the 23.6% Fibonacci retracement. Breaking this level may open the door for further losses with an eye on $41.60. The RSI indicator has pulled back from overbought territory as price consolidates, pointing to more downside risk.
XAUUSD
Gold has risen well. We continue to see a possible test of 1880 respectively in the next few sessions. The overall view on precious metal is to see a steady rise in the near term.
